

You may also enjoy
Best python libraries for Time Series Analysis
Time Series analysis involves a lot of tasks such as forecasting, classification, anomaly detection, time-series feature extraction, and sequence matching… e...

Top 10 songs of all time
As a music fan, selecting simply the top 10 songs of all time is quite difficult. But I’ll try my best to provide you with some of my own favorites.
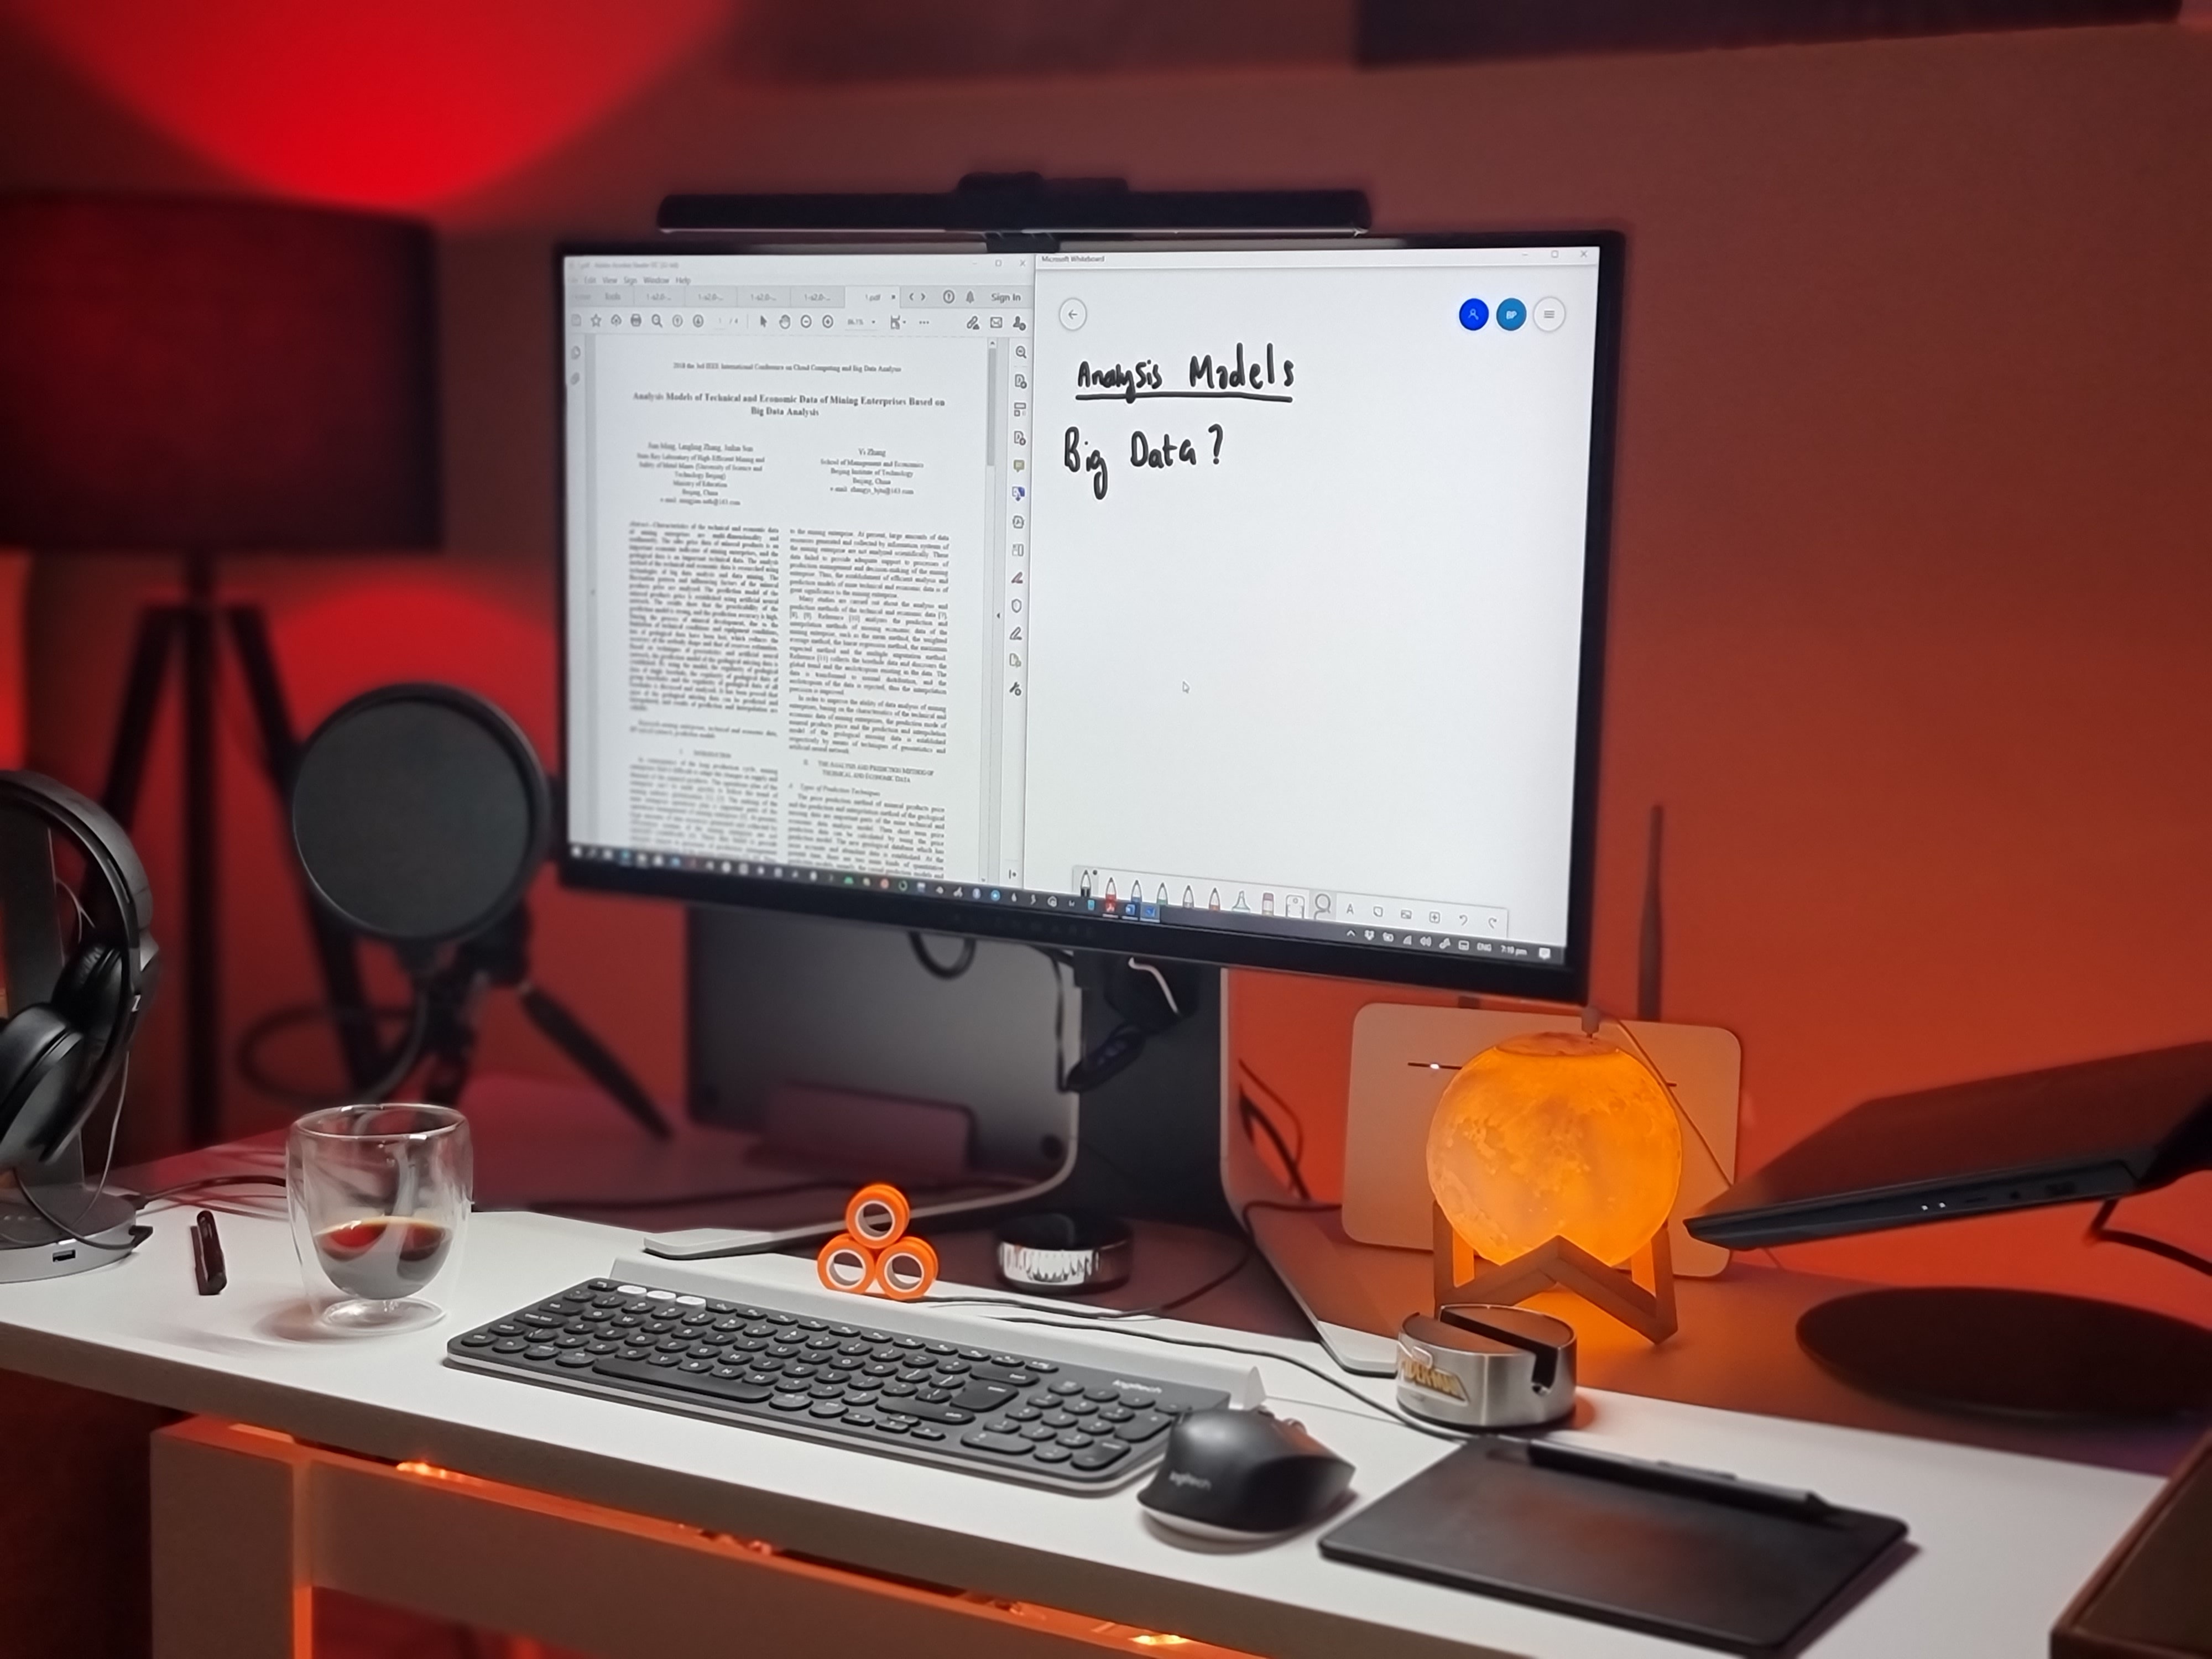
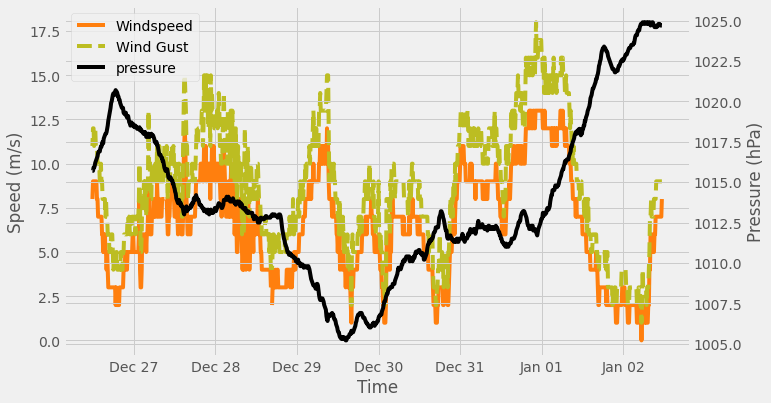
Data Science Project Environment
Step by step procedure to setup any data science project.
Leave a comment